| Previous | Content | Next |
The definition talks about "giftedness", e.g. "gifted", "highly gifted", etc, but I consider this wording to be problematic, because being gifted implies that you are particularly capable in one or more areas. However, you can be gifted without being highly intelligent and you can be highly intelligent without being gifted. There may be a correlation, but this is not certain. For instance, many extraordinarily intelligent people lack creativity. It's not necessary, because everything appears logical to them.
So let's talk about intelligence instead of "giftedness".
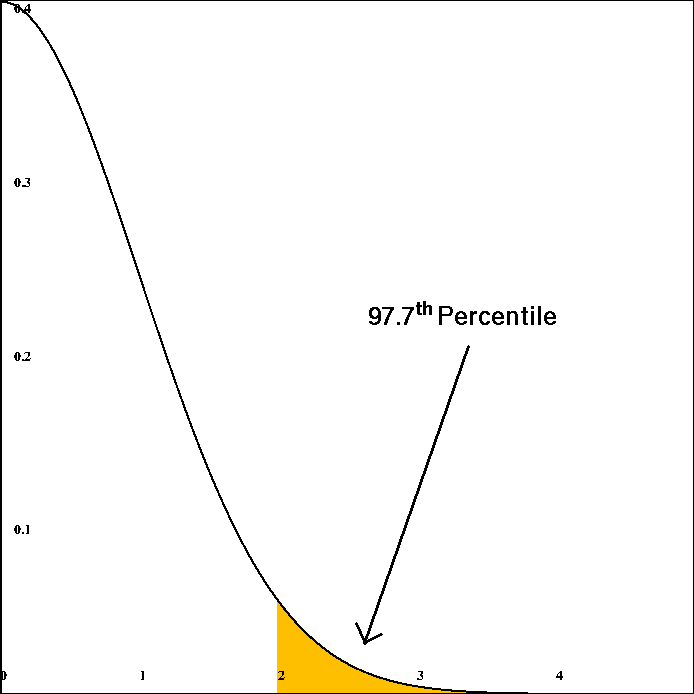
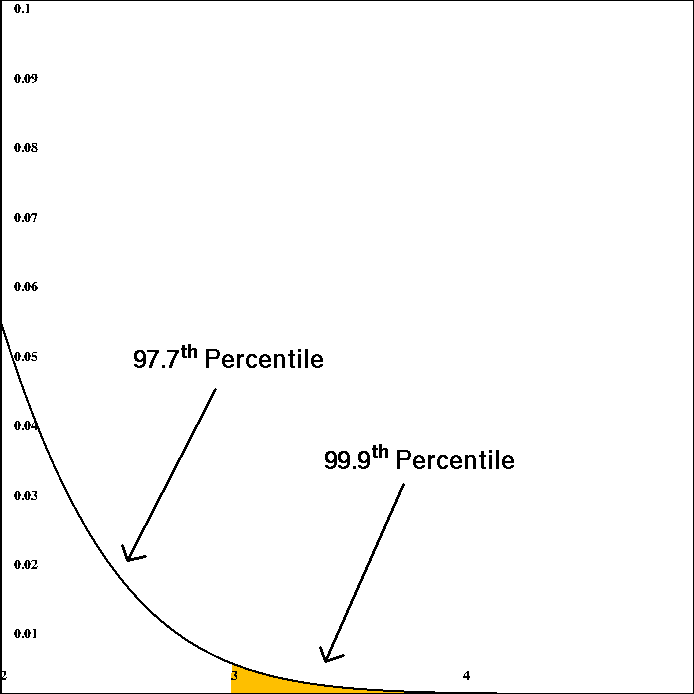
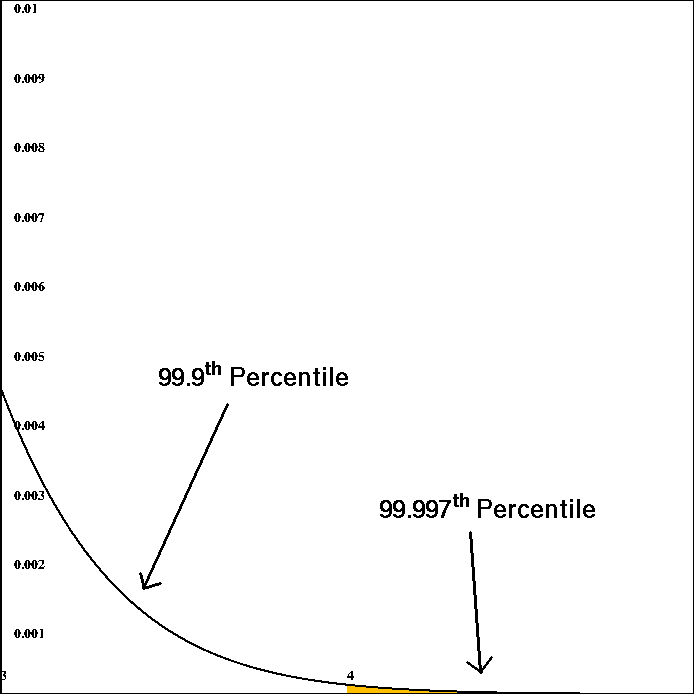
The IQ normal distribution used today has a mean of 100 and a standard deviation of 15 (μ=100; σ=15), so people scoring from 85 to 115 are considered to be "normally" intelligent. Here is a table summarizing the definition. [f6] (Yes, there's an overlap between the ranges.)
| Standard Deviation |
IQ Range |
Percentile |
Defined as |
|---|---|---|---|
| <-1σ | <85 | <15.9 | Below average |
| -1σ..+1σ | 85..115 | [15.9..84.1) | Average |
| +1σ..+2σ | 115..130 | 84.1 | Above average ("bright") |
| +2σ..+3σ | 130..145 | 97.7 | Very intelligent ("gifted") |
| +3σ..+4σ | 145..160 | 99.9 | Highly intelligent |
| +4σ..+5σ | 160..175 | 99.997 | Extraordinarily intelligent |
| ≥+5σ | ≥175 | 99.99997 | n/a (extremely rare) |
Areas under the normal distribution curve denote the probability of a random person having a score in a certain IQ range. The total area under the ND curve is 1.0. The probability of a person having an IQ of at least 100 is 0.5 (or 50%), corresponding to the "right" half of the curve. [f7]
Here are the areas for the 2nd, 3rd and 4th sigma [f8] [f9] [f10] (the areas are so small that we zoom into the curve by stretching the Y-axis; note the scaling!):
As can be seen here, scores above the 3rd sigma become increasingly rare. How rare exactly is demonstrated in the following table. [f11]
| Sigma | How rare? | How many? | ||
|---|---|---|---|---|
| Small Country (Sweden, 10M) |
Large Country (USA, 320M) |
World (7.3B) |
||
| +2 | 1/44 | 227,000 | 7,272,000 | 165,909,000 |
| +3 | 1/741 | 13,000 | 431,000 | 9,851,000 |
| +4 | 1/31,457 | 318 | 10,173 | 232,063 |
| +5 | 1/3,331,253 | 3 | 96 | 2191 |
| +6 | 1/801,239,314 | 0 (0.01) | 0 (0.4) | 9 |
Combined with the highest IQs ever measured, this table illustrates clearly how flawed contemporary tests are in the higher standard deviations. Using the current model, there would be a 1/247,157,686,604,053 (one in 247 trillion) chance [f12] of a random person having an 8σ IQ (≥220), but several of those have actually been measured.
Grady Towers, [2] who performed a lot of qualitative research in the area of high IQ and social integration, put the boundary roughly at 150 IQ points (3.3...σ). However, since he was primarily interested in helping people, he also pointed out that the suffering of the individual should be the ultimate criterion.
Wait, suffering from a high IQ?
| Previous | Content | Next |